


![]()
Operating a product development process near full utilization is an economic disaster.
—Donald Reinertsen
Principle #6 – Visualize and limit WIP, reduce batch sizes, and manage queue lengths
To achieve the shortest sustainable lead time, Lean enterprises strive for a state of continuous flow, which allows them to move new system features quickly from ‘concept to cash’. Accomplishing flow requires eliminating the traditional start-stop-start project initiation and development process, along with the incumbent phase gates that hinder flow (see Principle #5 and Lean Budgets).
Three primary keys to achieving flow are:
- Visualize and limit work in process (WIP)
- Reduce the batch sizes of work items
- Manage queue lengths
Visualize and Limit WIP
Overloading teams and programs with more work than can be reasonably accomplished is a common and pernicious problem. Having too much WIP confuses priorities, causes frequent context switching, and increases overhead. It overloads people, scatters focus on immediate tasks, reduces productivity and throughput, and increases wait times for new functionality. Like a highway at rush hour, there is simply no upside to having more work in a system than the system can handle.
The first step to correct the problem is to make the current WIP visible to all stakeholders. A Kanban board is a simple way of doing that. Figure 1 illustrates an example.
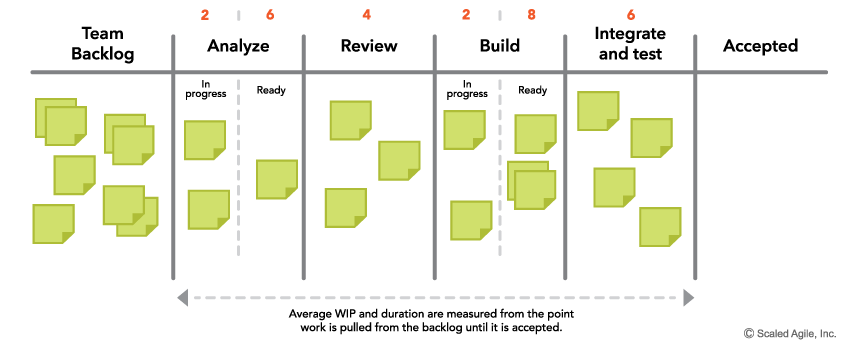
The Kanban board illustrates the total amount of work in process and the state of each work item. It also serves as an initial process diagnostic, showing the current bottlenecks. Often, simply visualizing the current volume of work is the wake-up call that causes practitioners to start addressing the systemic problems of too much work and too little flow.
The next step is to start balancing the amount of WIP against the available development capacity. This is done by establishing—and continually adjusting—WIP limits for the relevant states. Simply, when any workflow state reaches its WIP limit, no new work is taken on. This matches demand to capacity and increases flow through the system.
Limiting WIP, however, requires knowledge, discipline, and commitment. It may even seem counterintuitive to those who believe that the more work you put into the system, the more you get out. That can be true up to the point of nearly full capacity, but thereafter, the system becomes turbulent and throughput decreases. There is no substitute for effectively managing WIP.
Reduce Batch Size
Another way to reduce WIP and improve flow is to decrease the batch sizes of the work—the requirements, designs, code, tests, and other work items that move through the system. Small batches go through the system more quickly and with less variability, which fosters faster learning. The reason for the faster speed is obvious. The reduced variability results from the smaller number of items in the batch. Since each item has some variability, the accumulation of a large number of items has more variability.
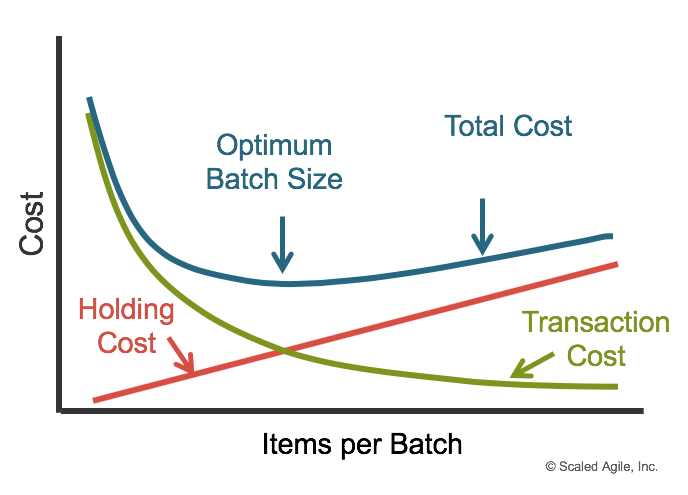
The economically optimal batch size depends on both the holding cost (the cost for delayed feedback, inventory decay, and delayed value delivery) and the transaction cost (the cost of preparing and implementing the batch). Figure 2 illustrates the u-curve optimization for batch size [1].
To improve the economics of handling smaller batches—and thus increase throughput—teams must focus on reducing the transaction costs of any batch. This typically involves increasing the attention to and investment in infrastructure and automation, including things such as continuous integration, automating the build environment, automated regression testing and more. (This is a primary purpose of implementing DevOps.)
Manage Queue Lengths
The third method of achieving flow is to manage queue lengths. Little’s Law—the seminal law of queuing theory—tells us that the average wait time for service from a system equals the ratio of the average queue length divided by the average processing rate. (While this might sound complicated, even the line at Starbucks illustrates that.) Therefore, assuming any average processing rate, the longer the queue, the longer the wait. Simply, reducing queue length decreases delays, reduces waste, increases flow and improves predictability of outcomes.
For solution development, this means that the longer the queue of committed work awaiting implementation by the team, the longer the wait time, no matter how efficient the team. So, for faster service, the length of the queue must be reduced or the processing rate must be increased. While increasing the processing rate (more efficient development and test practices, automation, etc.) is a consistent and common goal, the fastest method to reduce wait time is to reduce the queue length. As illustrated in Figure 1, visualizing the work helps immensely.
Here are some additional tips:
- Keep team and program backlogs short and largely uncommitted. This allows new, higher priority work to enter and leave the system with less wait time.
- Establish WIP limits for each process step. This means that the length of the queue in front of any one state is limited to the WIP limit.
- Be especially careful of large, long-term commitments. It’s always tempting to look into the future and make a long-range commitment which seems to satisfy the need for certainty about the future. But very long-term commitment increases the response time for new opportunities. In other words, every long-term commitment decreases the agility of the enterprise.
Summary
These three primary mechanisms for implementing flow—visualizing and limiting WIP, reducing the batch sizes of work, and managing queue lengths—increase throughput and accelerate value delivery. Implementing them gives people a sense of control over the process, and triggers fast and measurable improvements in customer satisfaction and employee engagement.
Learn More
[1] Reinertsen, Donald G. The Principles of Product Development Flow: Second Generation Lean Product Development. Celeritas, 2009.Last update: 10 February 2021